

Trusted on the hard problems
A three-year performance ceiling resolved in four weeks, then scaled to 1,000 concurrent users.
Read the case studyDrive long-term value through resilience and innovation.


Observability is the practice of unifying infrastructure monitoring, application performance, security analytics, and business metrics so IT teams and business leaders can see what's actually happening across their environment, not just isolated alerts from disconnected tools. A single transaction in a modern hybrid environment can involve up to 82 different technologies — traditional, siloed monitoring simply can't keep up.
Avocado's Observability practice covers infrastructure, application, digital experience, security, and business observability as one connected discipline, extended by AIOps and AI observability, built on Dynatrace and Splunk, delivered by certified engineers who focus on maximising the value of the platforms you already have.

Reactive, tool-sprawled monitoring turns every incident into a war room.

Uptime and resilience are business risks, not just IT metrics.

Siloed, after-the-fact monitoring can't keep up. One connected view can.
| Where to start | Who's it for | What's your pain point | What will change | How we measure it |
|---|---|---|---|---|
| Full Stack Observability | CIO, Head of Platform/SRE | Blind spots across fragmented tools | One view of every service, user to code | MTTD/MTTR, tools retired |
| AIOps | Head of IT Ops, SRE lead | Alert storms, slow triage | Preventive, automated operations | Alert volume, P1/P2 incidents, auto-remediated issues |
| AI Observability | CDO/CTO, AI platform lead | Uncontrolled AI cost, quality and risk | Governed, cost-transparent AI in production | Token cost per transaction, AI latency, guardrail violations |
| Digital Experience Observability | Head of Digital, CX or product owners | Not knowing what customers actually experience | Problems fixed before customers notice | Journey completion, user satisfaction, conversion |
| Business Observability (BizDevOps) | Digital/product owners, CIO | Business and IT working from different data | Decisions tied to revenue and customer impact | Conversion, journey SLOs, release frequency, change failure rate |
| Runtime Vulnerability Analytics | CISO, DevSecOps lead | Vulnerability noise without context | Fix what is exploitable first | Critical exposed vulns, time to remediate |
| Log Management & Analytics | Head of Ops, Security, FinOps | Siloed, costly logs | Instant in-context answers at predictable cost | Log cost per GB, query/investigation time |
| Infrastructure Observability | Head of Infrastructure, Cloud/Platform lead | Patchy visibility across on-prem, cloud and hybrid | Health and capacity issues caught before they hit services | Infrastructure incidents, unplanned downtime, resource utilisation |
Tailored assessments that identify gaps and opportunities across your current observability platforms.
Seamless deployment and configuration of observability tools, tuned to your business and your scale.
Moving your organisation up the observability maturity curve, from reactive monitoring to predictive insight.
Ongoing management of Splunk and Dynatrace so your team can focus on innovation, not platform upkeep.

Monitor LLMs, AI agents, and AI-powered applications for performance, cost, output quality, and guardrail behaviour.
Explore

Connect IT performance, incidents, and releases to business outcomes like revenue, conversion, and retention — including BizDevOps.
Explore
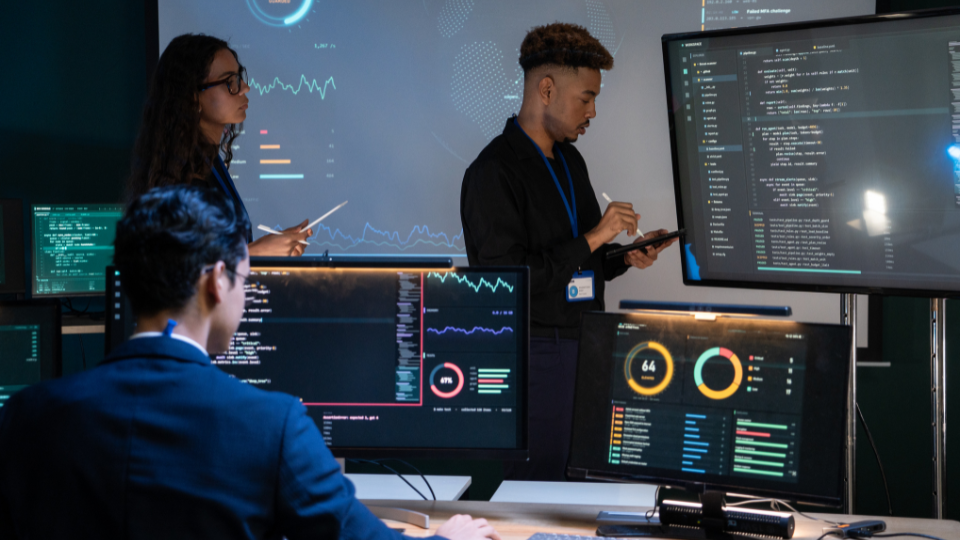
One platform across infrastructure, applications, logs, and user experience, with dependencies mapped automatically.
Explore

Comprehensive monitoring across on-premises, cloud, and hybrid environments.
Explore

Track user interactions and improve the customer journey with real-time performance data.
Explore

Turn log data from a cost centre into instant, in-context answers, with predictable costs and sensitive data masked at ingest.
Explore

Detect vulnerabilities in running applications and prioritise them by real-world exposure and business context.
Explore

AI-driven event correlation, root cause analysis, and automated remediation to cut alert noise and resolve incidents faster.
ExploreBuilding AI as well as running it?
Avocado’s Data and AI practice designs and builds AI systems, from data platforms and machine learning to generative and agentic AI, along with the governance that sits over them. Working together, our two practices design observability in from day one, not bolted on after go-live.
Start with an Initial Environment Discovery
A focused, low-commitment engagement that builds a roadmap to a fully observable system. Want a structured diagnostic first? Take the Observability Maturity Assessment.
Certified across Dynatrace and Splunk. 10+ years with Dynatrace and 15 with Splunk, with a certified team covering implementation, optimisation, and managed services on both.
Recognised across APAC, including Special Recognition of Excellence APAC 2026.
Onshore and hands-on, Australian-based consultants who know local regulatory, government, and enterprise environments.
Built to leave you capable. We embed specialists, solve the problem alongside your team, and transfer the knowledge.
A whole community of practice behind every engagement, not a single consultant working in isolation.
Customer success built in with a dedicated Customer Success Manager on every engagement as standard.
We fix as well as build by correcting poor or incomplete existing implementations, not just building new ones.
Dynatrace and Splunk as our primary platforms, alongside Red Hat, Palo Alto Nextwave, AWS, Azure, 2 Steps, Airlock Digital, and MyRisk.
Describe a situation this service addresses.
A three-year performance ceiling resolved in four weeks, then scaled to 1,000 concurrent users.
Read the case study

Observability across 10,000+ assets, saving the team around 30 hours a month.
Read the case study
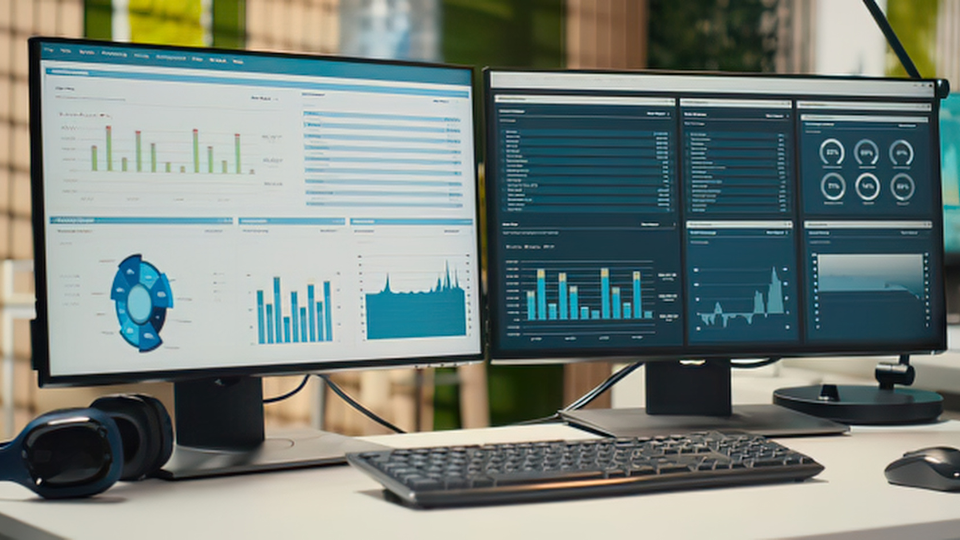
Real-time views from ministerial to hospital level, critical enough to be reported daily during peak demand.
Read the case studyObservability is the practice of unifying infrastructure, application, security, and business monitoring into one connected view, so teams can understand what's happening across a complex environment rather than piecing it together from disconnected tools.
Traditional monitoring watches individual, predefined metrics in isolation. Observability connects infrastructure, application, security, and business data together, so teams can understand root cause and business impact, not just that something went wrong.
No — there's no assumption that anything needs to be replaced. Whether you use Dynatrace, Splunk, Datadog, or several tools at once, the real question is whether your current combination gives you one unified view and fast root-cause identification. Consolidation happens only where it genuinely reduces complexity.
It depends on your starting maturity and environment complexity — engagements range from a short discovery and roadmap through to a multi-phase uplift. An Initial Environment Discovery is the best starting point to scope this accurately.
Yes — the Initial Environment Discovery is a focused engagement that builds a roadmap toward a fully observable system, without committing to a full uplift upfront.
Ready to transform your observability and security?
Talk to us, or start with an Initial Environment Discovery.